Irrigation is used as a tool for regional development in Brazil and other countries.
| New method maps the annual variation of effectively irrigated agricultural areas based on soil moisture indices.These indices are obtained from freely accessible, medium-resolution images from the Sentinel-2 satellite. The method also uses Artificial Intelligence (AI).This new feature distinguishes whether soil moisture actually comes from irrigation, even if it occurs during rainy periods.In an innovative way, it provides information on the actual size of the irrigated area in each mapped plot and differences from one harvest to another.Five hotspots in Goiás and Mato Grosso have already been mapped using this method.The data obtained will be used by the Ministry of Integration and Regional Development (MIDR) to monitor public policies on irrigation. |
Embrapa Territorial has developed a method using satellite imagery and Artificial Intelligence (AI) to map the annual growth or reduction of effectively irrigated agricultural areas based on soil moisture levels. This initiative addresses a need of the Ministry of Integration and Regional Development ( MIDR ) for monitoring public policies focused on irrigation. The new method is already being applied to map five irrigation hubs in the states of Goiás and Mato Grosso.
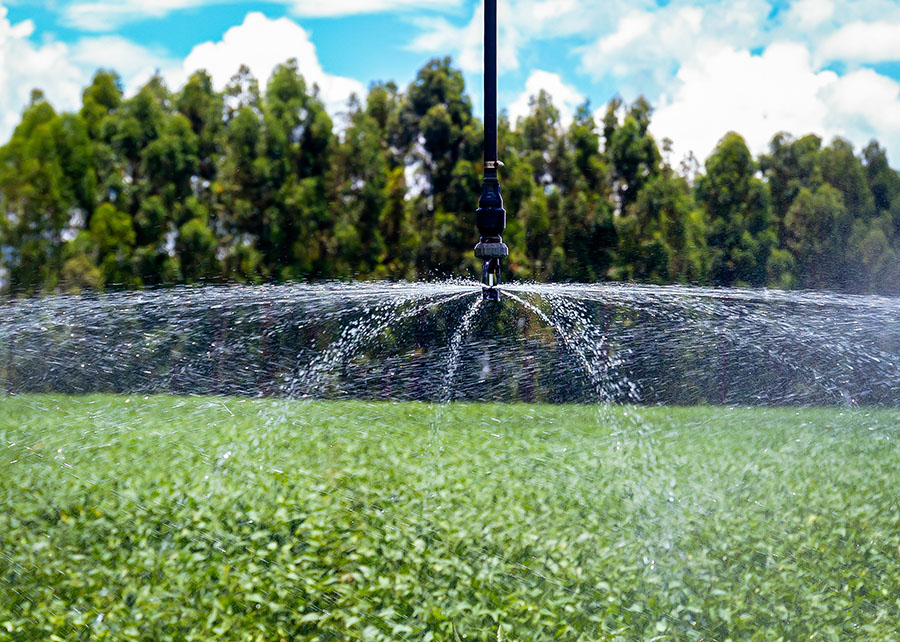
Responsible for mapping the first irrigation hubs in Goiás, analyst Rafael Mingoti , from Embrapa Territorial, explains that the initial challenge was to generate a map that would allow for the verification of differences between harvests. Recording the well-known circles formed in the soil by center pivot irrigation systems, for example, would not be effective, as they are like a scar in the soil that remains from one year to the next. Another factor is that producers use different irrigation methods. Alternatively, searching for irrigation equipment would also not be sufficient because it may be deactivated, despite being present. “The objective is to identify the lands that were effectively irrigated in the year in question and not those that only have the infrastructure,” emphasizes Mingoti. The research team began analyzing soil moisture from indices obtained from medium-resolution images and free access from the Sentinel-2 satellite.
However, there was another challenge. In the state of Goiás, irrigation is predominantly used not during the dry season, but rather during the summer, when rainfall occurs and when there is available flow in waterways. Especially due to climate change and the increased occurrence and duration of dry spells (periods without rain in the summer), farmers resort to irrigation to avoid losses.
The general coordinator of sustainability for irrigation projects and hubs at MIDR, Antônio Guimarães Leite, adds that this resource is also used in other regions of Brazil, with the same objective or to bring forward the first harvest. In some situations, this allows extending the planting window and enabling up to three harvests in the same agricultural year.
But if irrigation occurs during the rainy season, how can you tell if soil is moist because it was irrigated or because it received rain? “We use other indicators. Generally, irrigated areas are not very small and have regular shapes – rectangles, circles, or triangles,” explains Mingoti.
Actual size of the irrigated area
In addition to location, MIDR also needs information on the size of irrigated areas. As an innovation, the method has used resources derived from radar remote sensing to arrive at the total area. Unlike the traditional method, which calculates the area by adding “pixels” (frames that make up the image), the vectorization technique draws the real outline of the terrain, as if following the exact line of the irrigated area. In pixel counting, the system considers the entire frame, even if part of the terrain it covers is not irrigated. “When the terrains are vectorized, we eliminate possible errors inside and outside the irrigated area. Therefore, the measurement is much more accurate,” says Mingoti.
In this phase of the work, Embrapa Territorial developed the method and applied it to mapping two irrigation hubs in Goiás (Central Plateau and Araguaia Valley) and three in Mato Grosso (South, Middle North, and Araguaia-Xingu). The mappings of the first two have already been delivered to the Ministry, and the others are in the validation phase.
Mapping in the Central Goiás irrigation hub showed an increase of 7,000 hectares in irrigated areas from 2023 to 2024. There was growth in irrigated area across the 24 municipalities that make up the region. In addition to being used for more frequent evaluation of public policies, the intention is that the mapping data will be integrated into the National Irrigation Information System.